HR analytics: making diagrams meaningful
29.01.2019
The client does not want many details - he needs a summary on one page. We go to extremes when get rid of details, and leave only rough averages on the slide. How do we preserve the balance between visual attractiveness and informative contents of the report? Let me give you a real-life example.
HR manager Kristen was promoted to Deputy Head of Department. Her first task in the new capacity was to prepare an annual report on company staff changes for the management and shareholders of the company.
Kristen chose the indicators, studied the reports from previous years, registered the dynamics and started to work on the design. She was good at making presentations, and the slide for the annual report was no exception. Kristen chose the non-standard 5х2 grid, where 5 KPI cards and 2 rows of charts, 3 to each, fitted neatly. The colour scheme, the alignment, subheadings, legends and text - all looked neat and low-key.


Get my book and discover dashboard insights for free
* By clicking the button you agree to the privacy policy
* By clicking the button you agree to the privacy policy
The first impression Max, Head of Department, had was positive. He started preparing the report and then he understood that he was unable to deliver anything of particular interest - only the general indicators, nothing specific, no comparisons made, and some data were plainly useless. He tried to go into the reasons for that.
The level of KPI is superb. But what do the figures for the current period say? Is it too much or too little? Has the figure grown or fallen? It would be great to see the differences with last year's figures and look at an indicator that would show whether the changes are for the better or for the worse.
Staff numbers is key information. But what is within this figure? How many new employees have come, how many have been fired? The dynamics of both these figures would speak for the growth rate and stability level of the company. Besides, it is important to see the number of employees inside every department.
Max sent a check-list with corrections to Kristen with the following points:
Besides the dynamics of the past 4 years, it would be good to see the data on staff turnover in different departments. It is also necessary to compare it against general staff numbers and track the overall picture in dynamics.
6. Unite the staff numbers charts with the staff turnover charts;
7. Get rid of the pie charts;
8. Add data on the reasons for staff resigning in 2017.
It would be interesting to see how the reasons for resignation have changed compared to the previous year. This will enable us to analyse staff loyalty in the company and perfect the system of motivation.
Kristen understood all the mistakes, gathered the missing information and corrected the report accordingly. This was the result of her work:
- Quality content of KPI cards: staff numbers, hired, fired, staff turnover, successful internships;
- Add variations and colour indicators to KPI cards;
- Add data on the numbers of people hired and fired to the numbers chart;
- Add a chart of department staff numbers in 2018;
- Add data on staff turnover in different departments in 2018
Besides the dynamics of the past 4 years, it would be good to see the data on staff turnover in different departments. It is also necessary to compare it against general staff numbers and track the overall picture in dynamics.
6. Unite the staff numbers charts with the staff turnover charts;
7. Get rid of the pie charts;
8. Add data on the reasons for staff resigning in 2017.
It would be interesting to see how the reasons for resignation have changed compared to the previous year. This will enable us to analyse staff loyalty in the company and perfect the system of motivation.
Kristen understood all the mistakes, gathered the missing information and corrected the report accordingly. This was the result of her work:

Max was content with the quality content of the report and the new chart grouping. Following this version, he prepared a useful, substantiated report:
In 2018 the staff numbers are 215 employees.This is 24 percent more than in 2017. AT the same time, the amount of new employees has grown by 36% reaching 59 people, while the amount of those dismissed has halved and made 26 people.
The staff turnover in 2018 is at the lowest point for the past 4 years, standing at 12%. The number has decreased by 21%, as compared to the previous year.
Most of employees have been hired to the Sales Department, but the staff turnover has been at its highest, at the point of 15%. Despite the low staff numbers in Project Management Department, the staff turnover there exceeds the average figure in the company.
The main reason for resignation in 2018 is moving to a more highly paid position and personal dissatisfaction with the position held in the company. It is also important that the ratio of resignations due to dissatisfaction with the company has decreased by 10 percent. This indicates an improvement in working conditions and environment. In 2019 we plan to develop a system of motivation to retain more employees.
When reducing the amount of data on dashboards and trying to leave conclusions only, make sure that the report does not lose its primary focus and sense.
* By clicking the button you agree to the privacy policy
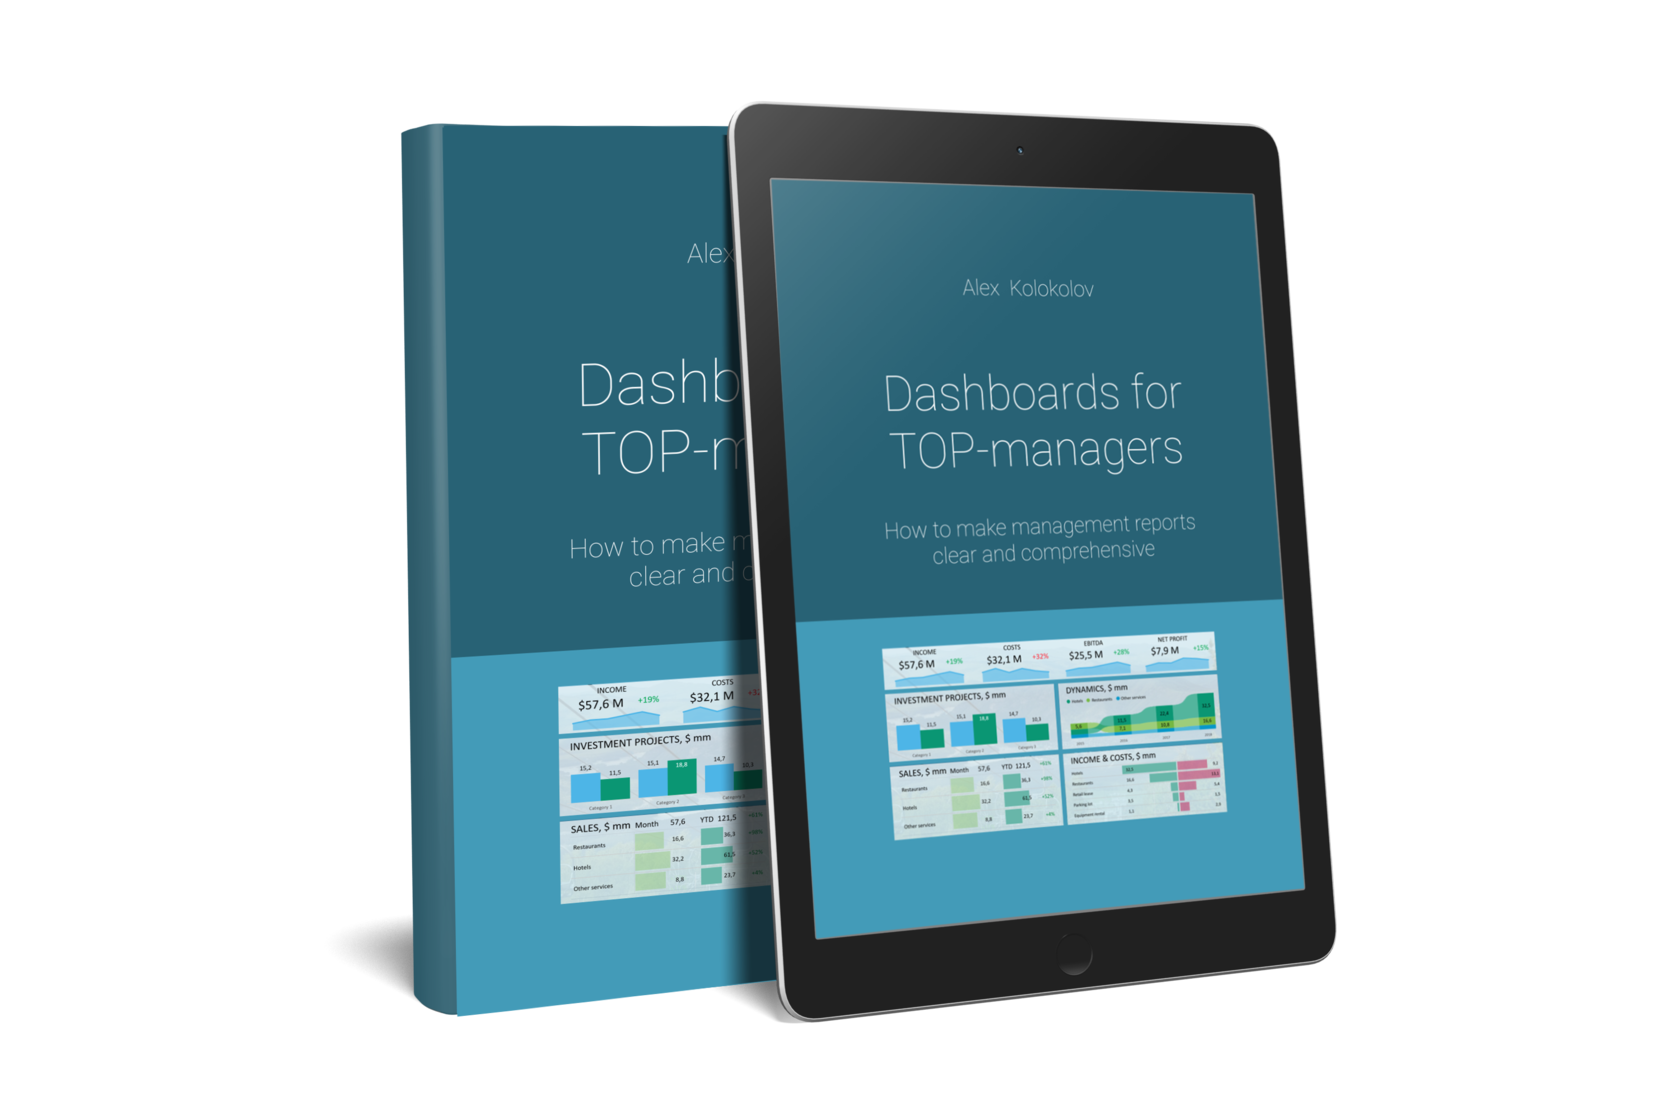
You'll find simple and precise rules for creating great dashboards in my book «Dashboards for TOP-Managers». We'll send you a free copy of it via email
Get my book and discover dashboard insights for free
+995 557 525 549
Georgia, Batumi, Ximshiashvili 7