Digital transformation: myth and reality
27.04.2020
Every progressive business owner or top manager wants a dashboard - a symbol of the digital era coming from the world of data. Everybody dreams of lying on the seashore and looking at the tablet, following the growth of a sales graph and identifying those responsible for a fall in profits.

This idyllic picture is seldom real. All the corporate report initiatives and end-to-end analytics perish in routine, endless data reconciliation, while automation cannot keep up with the rapid change of business processes. As a result, we have good old Excel and PowerPoint instead of Big Data.
'Make a simple dashboard, that's all'
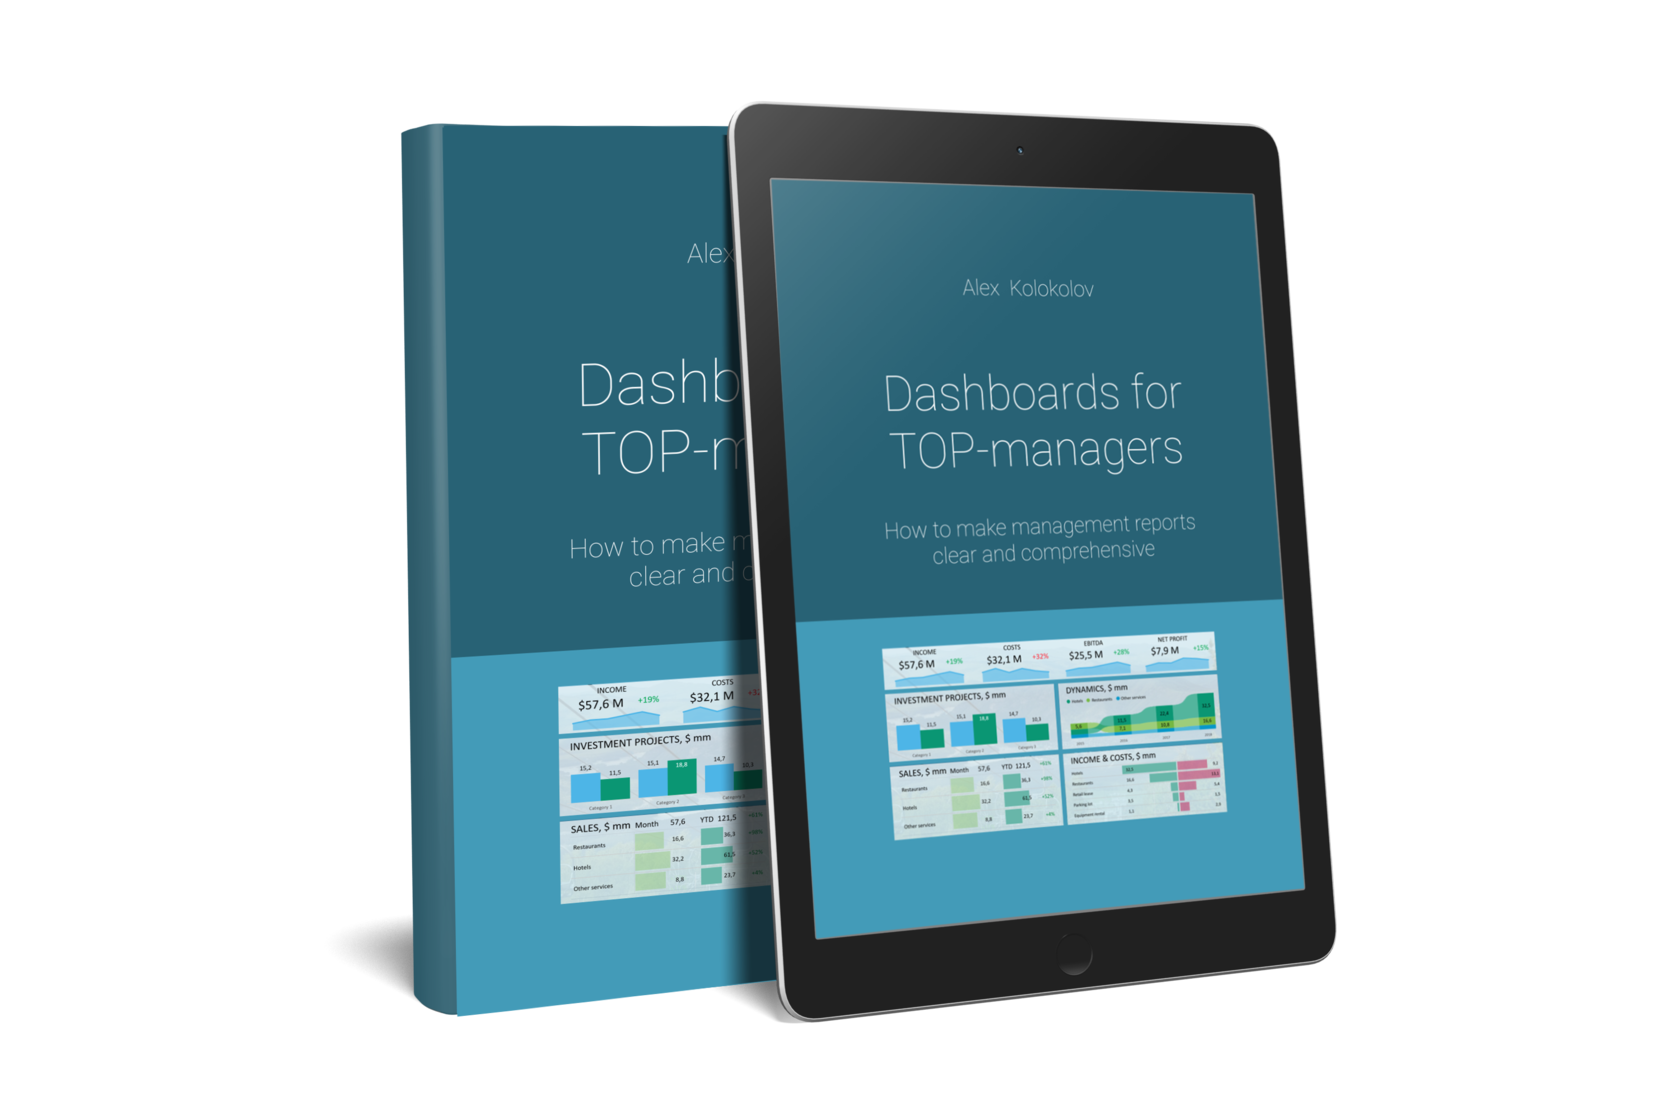
Get my book and discover dashboard insights for free
* By clicking the button you agree to the privacy policy
* By clicking the button you agree to the privacy policy
Directors come with these requests to their IT specialists and financiers, but never get the expected result. The problem is that every business is at a different stage of digital maturity: someone is implementing 1C and CRM, while others have 10 years' record of management accounting and budgeting.
While someone is happy with one Excel file, others cannot work without a database and a team of analysts. To have the necessary support in decision making, a company should go through all the consequent stages of 'maturity'. Sadly, some companies try to skip some stages, which leads to errors and wasted investments. Let me share a couple of stories from my personal experience in these mistakes.
Once a client came with the request of 'making a simple dashboard in Excel. I only need a digest of legal entities in the holding: sales and finance, without the details of production and costs'. All the KPIs were approved, and there were only design and development left. I assigned one analyst for this mini-project and was waiting for the payment by the end of the month. As it turned out, our report was running slow and took 5 minutes to open.
I learned that in the middle of the working process the client asked to add 'just one more tab', and my employee agreed. Then a couple of indicators more, which needed 50 more data fields to calculate. Then some other things, and in the end, the dashboard that was originally planned as a presentation turned into a database.
This could have been done in Excel: first the analytical framework with calculations, then a separate file with a dashboard to visualize the results. As for the '2 for the price of 1' attempt, it failed again.
This could have been done in Excel: first the analytical framework with calculations, then a separate file with a dashboard to visualize the results. As for the '2 for the price of 1' attempt, it failed again.

'Why didn't you figure it out?'
The other story is about a mature company from the financial sector. They had 'everything in SAP' and even data storage. Our task was to implement dashboards with end-to-end sales ratings: from plan implementation all around the company to every office and manager. Technically, we had to come up with a tricky system for calculating bonuses for different products, and also the non-financial KPI of the sales staff.
On a separate stage we approved the brief, designs and the working plan for half a year. In the end, the client waited twice as long and received half as much. In the midst of the process it turned out that nobody trusted the SAP data - the margin had to be obtained from financiers' files, who calculated it manually. Some KPI were rejected, and with some indicators the logic did not quite fit the real figures. I will give you one example.
On a separate stage we approved the brief, designs and the working plan for half a year. In the end, the client waited twice as long and received half as much. In the midst of the process it turned out that nobody trusted the SAP data - the margin had to be obtained from financiers' files, who calculated it manually. Some KPI were rejected, and with some indicators the logic did not quite fit the real figures. I will give you one example.
We show the dashboard to the Head of the Sales Department and he says that the percentages of plan implementation are wrong. We check the plan totals and the facts on the departmental managers - everything adds up. And then he makes a confession, 'The plan totals for the managers and the departmental plans should not add up. We overstate their plan, and enter realistic estimates into our budget. Why didn't you figure it out?'
There are many situations like 'Your dashboard is lying', 'Sure, the mistake is in our database' and so on. Although the original dashboards turned out to be somewhat defective, the consumer received the result of the previous stage - an analytical framework with reliable business indicators.
There are many situations like 'Your dashboard is lying', 'Sure, the mistake is in our database' and so on. Although the original dashboards turned out to be somewhat defective, the consumer received the result of the previous stage - an analytical framework with reliable business indicators.
What do we do with this?
I have learned my lesson from these stories and I supervise work processes more carefully now. I write out possible risks in the contract or just refuse to take on hopeless projects. Unfortunately, full-time analysts find it hard to say no to their boss's 'just one more tab'.
This is why I am saying this to all company executives: do not try and get it all at the same time. You can surely make everyone run around and compile an annual report within a week. But this is an emergency rather than a systemic approach. The transformation begins from inside your mind, with assessment of your maturity and gradual development under your supervision.
This is why I am saying this to all company executives: do not try and get it all at the same time. You can surely make everyone run around and compile an annual report within a week. But this is an emergency rather than a systemic approach. The transformation begins from inside your mind, with assessment of your maturity and gradual development under your supervision.
* By clicking the button you agree to the privacy policy

You'll find simple and precise rules for creating great dashboards in my book «Dashboards for TOP-Managers». We'll send you a free copy of it via email
Get my book and discover dashboard insights for free
+995 557 525 549
Georgia, Batumi, Ximshiashvili 7


