4 Paradoxes on the Way to Data-Driven Culture
27.08.2020
What skills are required from an analyst when building a data-driven system?
Staff working with data and reports can be divided into 3 groups: analysts, picture people, and technicians. They have different roles, tasks, processing, and results. This is where the paradoxes of their attitude to work arise.

Paradox 1. Analysts do not need visualization
Prefect tools for analysts are Excel, OLAP cubes. For them, the result is in the intersection between several tables or arrays. Simple diagrams are just beautiful pictures for them. They understand the value of dashboards, but make them too complex, with many bookmarks where filters take up half of the screen.
Prefect tools for analysts are Excel, OLAP cubes. For them, the result is in the intersection between several tables or arrays. Simple diagrams are just beautiful pictures for them. They understand the value of dashboards, but make them too complex, with many bookmarks where filters take up half of the screen.

Multi-filter dashboard that only analysts can understand
Here is a problem - an analyst doesn't know how to delegate access to information. They will collect data and prepare the necessary sample upon your request.
Paradox 2. Picture people – analysts with developed visual thinking – don't care about data quality
Picture people know how to turn tables into clear diagrams and slides or even dashboards. However, picture people shape the analysis results, and in pursuit of harmony and aesthetics, the reliability of information pales into insignificance for them.
Picture people know how to turn tables into clear diagrams and slides or even dashboards. However, picture people shape the analysis results, and in pursuit of harmony and aesthetics, the reliability of information pales into insignificance for them.

Factors of the actual payroll deviation from the planned one
Then a picture person can miss important details that an analyst-researcher would definitely pay attention to. The picture person could not pay attention to the context, if a diagram itself looks clear and logical.
Paradox 3. Technicians do not care about business results
Data-Scientist, Machine-Learner, it all sounds cool, but it is the profession of a mathematician, a programmer that works with algorithms. For them, the technical side is important, the nature of the relationship described by the model of machine learning, but what to do with this information further does not bother them. They will build you a model of an ideal employee's professional competencies, but will not tell you how to find one and how to manage them. Visualization is also of little interest to a programmer if it is not a database communications scheme. They are not responsible for data quality either. Their area of responsibility is stable work, system performance, and absence of errors.
Paradox 4. Business needs text
In the beginning of the article I talked about three roles, but there is another participant in the process — the business customer, the executive who makes decisions. They don't care about visualization, depth of analytical research, or the algorithm workability. Business needs conclusions, clearly defined options for solutions or strategies, as well as forecasts about what they can lead to. They need text, visualization, and conclusions, all on one screen.
In the beginning of the article I talked about three roles, but there is another participant in the process — the business customer, the executive who makes decisions. They don't care about visualization, depth of analytical research, or the algorithm workability. Business needs conclusions, clearly defined options for solutions or strategies, as well as forecasts about what they can lead to. They need text, visualization, and conclusions, all on one screen.

Management dashboard with a block of written conclusions
I began to see more and more dashboards which contain a block with written conclusions, and even BI-systems add-ins that automatically generate text from a dashboard.
What's next?
So, analysts look for answers to questions and structure data, picture people create a harmonious picture, technicians derive algorithms, and business waits for simple and clear conclusions. You should not expect one single expert to set up your system of end-to-end analysis of all business processes. Here you need teamwork where people complement each other. You can argue that hiring a whole team of analysts of all kinds is too expensive, and ordering a project from a systems integrator is even more expensive. You can get the result without increasing human resources. In order to achieve a balance, you will have to involve the management team, immersing them in the operational activities, process metrics, taking on roles of technicians, or at least analysts or picture people. This is the 'rightest' option when the director becomes chief analyst and leader of the culture of data-driven decision making.
So, analysts look for answers to questions and structure data, picture people create a harmonious picture, technicians derive algorithms, and business waits for simple and clear conclusions. You should not expect one single expert to set up your system of end-to-end analysis of all business processes. Here you need teamwork where people complement each other. You can argue that hiring a whole team of analysts of all kinds is too expensive, and ordering a project from a systems integrator is even more expensive. You can get the result without increasing human resources. In order to achieve a balance, you will have to involve the management team, immersing them in the operational activities, process metrics, taking on roles of technicians, or at least analysts or picture people. This is the 'rightest' option when the director becomes chief analyst and leader of the culture of data-driven decision making.
* By clicking the button you agree to the privacy policy
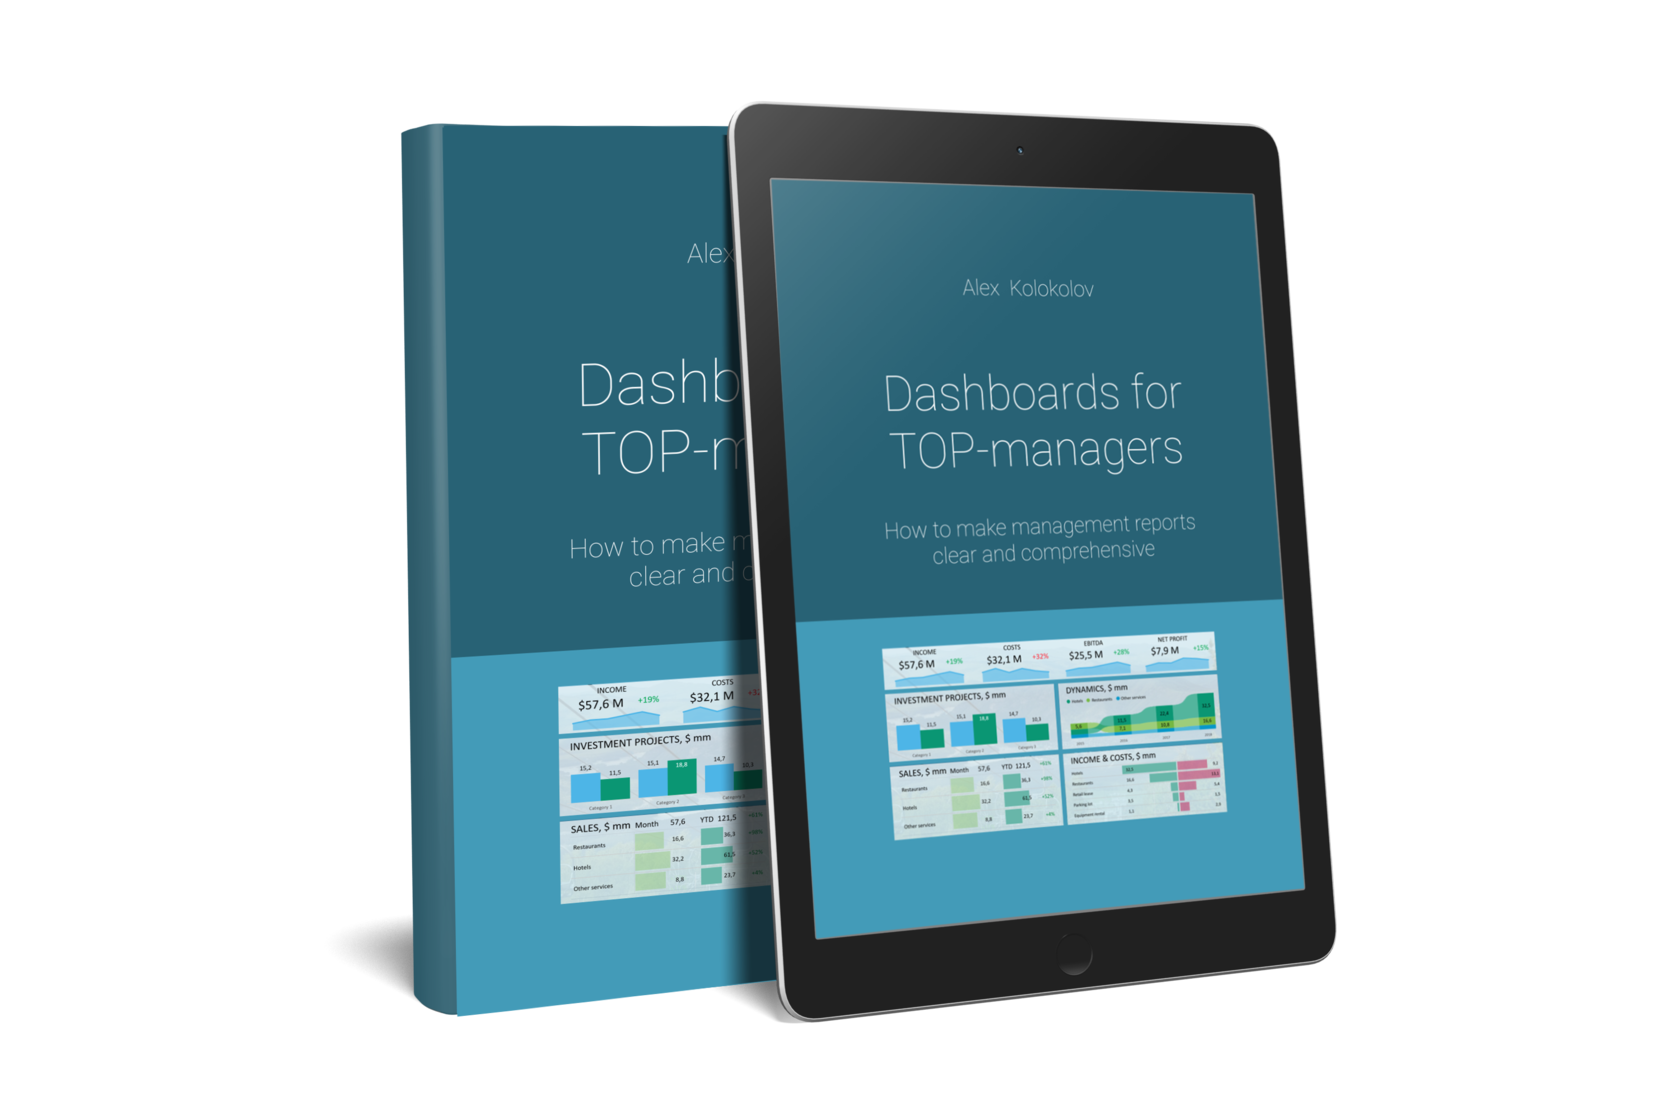
You'll find simple and precise rules for creating great dashboards in my book «Dashboards for TOP-Managers». We'll send you a free copy of it via email
Get my book and discover dashboard insights for free
+995 557 525 549
Georgia, Batumi, Ximshiashvili 7