Dashboard for presentations
18.06.2020
One of the very common problems is preparing a presentation for an important meeting the night before it takes place. This is because your colleagues had sent you the data only the day before and all in different formats. So you have to clean and consolidate it, and make the charts look in accordance with the corporate presentations template.
Technically, it's easy: calculate tables, draw charts, copy them to a slide and align. However, this involves a lot of routine work, which can be irritating, for example making 10 almost identical slides that differ only in filter.
One naturally wants to make a dashboard out of this to be able to click on slices and see data selections on the same screen. But not every customer is willing to have that. For many, it is still habitual to watch the slides and even print them out.
Under such restrictions the solution is a slide show: an Excel dashboard in a slide format. The infographics are already aligned and configured for the brandbook. All that is left to do is to copy the content to the slide.

Step 1. Data
Use pivot tables if you want to work with interactive slices. To do so, the source data must be in "flat" form. This means that each attribute and indicator is stored in a separate column, and there is no multi-level header.
A typical problem is dates. Most people prefer adding data for each month by creating new columns on the right. But this is not the way to create a pivot table. One must make a separate column for dates and enter each record in a new row. And if you want to be able to filter by year, quarter, then create columns for them straight away. Special insertion and transposition can help in this, but not always. Sometimes you have to do everything manually.
Store numeric indicators in the same manner. And immediately fixate the cell formats in the columns for dates, finance, and text.

Correct way of creating of a flat data table for the subsequent formation of a pivot table and, on its basis, a dashboard for quick presentations

Get my book and discover dashboard insights for free
* By clicking the button you agree to the privacy policy
* By clicking the button you agree to the privacy policy
Step 2. Dashboard
Then we make selections in pivot tables and draw diagrams based on the corporate model. Bringing pivot charts into full compliance with the sample can be difficult. For example, the scale on the chart began monthly for the current year, then quarterly for the previous year, and then by year. I didn't figure out how to do this using standard tools, so I visually combined the three diagrams. As a result, they look like one.

We place the three diagrams correctly so that visually they look like one. Thus, the usefulness for visual analytics increases significantly.
Next, we collect the final layout, align, configure captions and headers, and make the necessary slices. When new data appears, we simply add rows at the bottom of the flat table, and the charts will update automatically. The colour scheme can be irritating, but there's nothing you can do about it - "it's become traditional".

Dashboard for quick design of corporate brand book presentation.
Step 3. Presentation
The Chairman of the Board sees the overall picture at the meeting and then asks: what are the performance indicators for Mos Nordic in Sweden? Click two buttons and get the answer - this is faster and more convenient than scrolling through slides.

Dashboard, pivot charts, quick preparation of presentations for board members
If the customer still wants the good old slides, then our dashboard turns into a slide show. By clicking a data slice you can either make a screenshot or copy the charts to a slide. One of my clients put together an 80-slide presentation this way.
Summary
1. Collect the data in a flat table. Even though it is a few hours of copy paste, you will thus save time when updating and finalizing your charts.
2. Create separate columns for data slices. The more the better. This will give you more opportunities to "twist" the data.
3. Configure the dashboard in accordance with the brand book only once and update the data without any further need for "design work".
The main thing is to remember that you are analysts and not decorators! Automation will not deprive you of your work - rather, it will allow you to devote more time to analysis and searching for business insights.
* By clicking the button you agree to the privacy policy
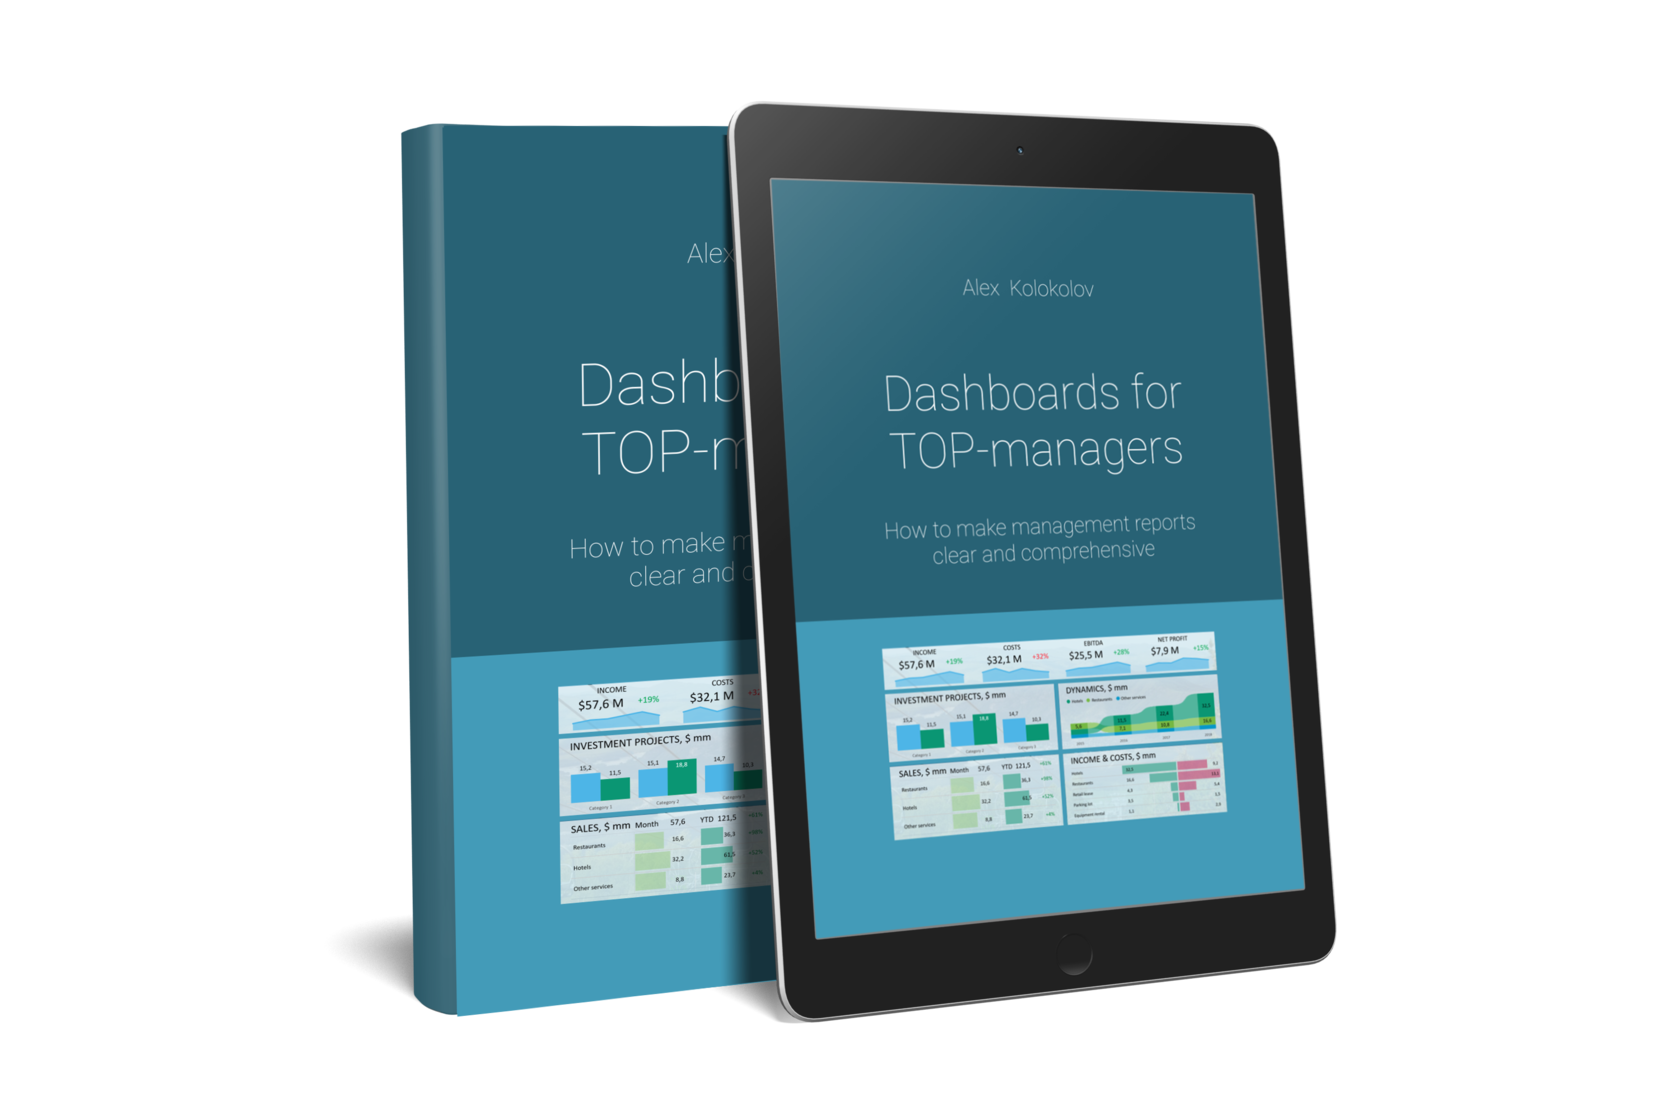
You'll find simple and precise rules for creating great dashboards in my book «Dashboards for TOP-Managers». We'll send you a free copy of it via email
Get my book and discover dashboard insights for free
+995 557 525 549
Georgia, Batumi, Ximshiashvili 7